


Guide to using charts
- News
- Guide to using charts
Guide to using charts
There are 2 types of diagrams in the Gashtavar product catalog. The first diagram shows the fan carve at the static pressure and air flow in different speeds. With this diagram, you can get the amount of air flow only according to the static pressure:
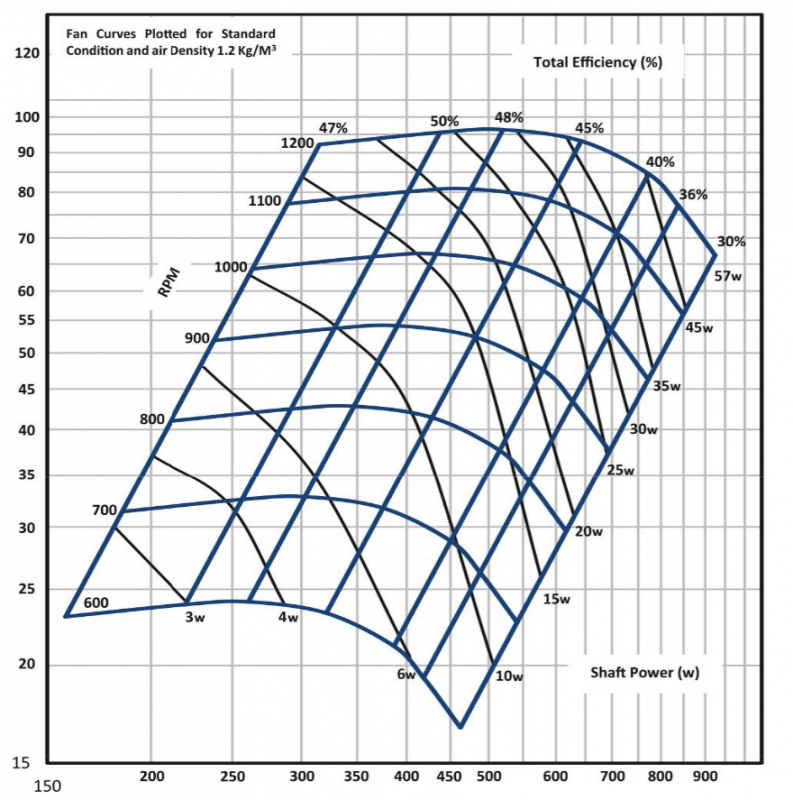
In the second diagram, total pressure and air flow are the basis for showing fan carves. This diagram also shows shaft power, dynamic pressure and fan efficiency in working conditions.
To get the information in this chart, it is enough to have two of the five variables. If we connect these two amount, we can reach our working point. For example, in the F1520 diagram, if we want to have 400 cfm air flow with a total pressure of 55 pa, we will need a 30 w electro motor with 1000 rpm, in which case the static pressure is approximately 15 pa and the efficiency is 36%.
You can also use the following formula to calculate fan efficiency at your workstation:
Fan efficiency=(Pt(pa) × q(m^3/s))/(BHP×E_m×PF)
Pt = Total pressure (pa)
q= air flow (m^3/s)
BHP= Shaft power (hp)
Em= motor efficiency
PF= Power factor (usually 0.9)
 Office: No. 08, Afsar Alley, Shariati St. Tehran, Iran
Phone: +98 21 - 22005831-2
Office: No. 08, Afsar Alley, Shariati St. Tehran, IranPhone: +98 21 - 22005831-2